I'm axed at zero!
The Blind Squirrel's Monday Morning Notes, 9th September 2024.
No bold recession calls to be found here. However, high yield credit spreads just look way too tight.
I'm axed at zero!
I guess we need to have that conversation about recession risk (again!). The cycle has been one of the failures of the so-called ‘fail safe’ recession indicators. Most recently we have seen US 2-year and 10-year yields finally un-invert for the first time since July 2022, breaking a record that had held since the 1970s.
Earlier this summer, a forest worth of column inches was spent debating the recessionary implication of a triggering of the ‘Sahm Rule’, even when the economist whose name is attached to this measure of rate of change in (U3) unemployment was on the airwaves furiously contending that it did not count this time!
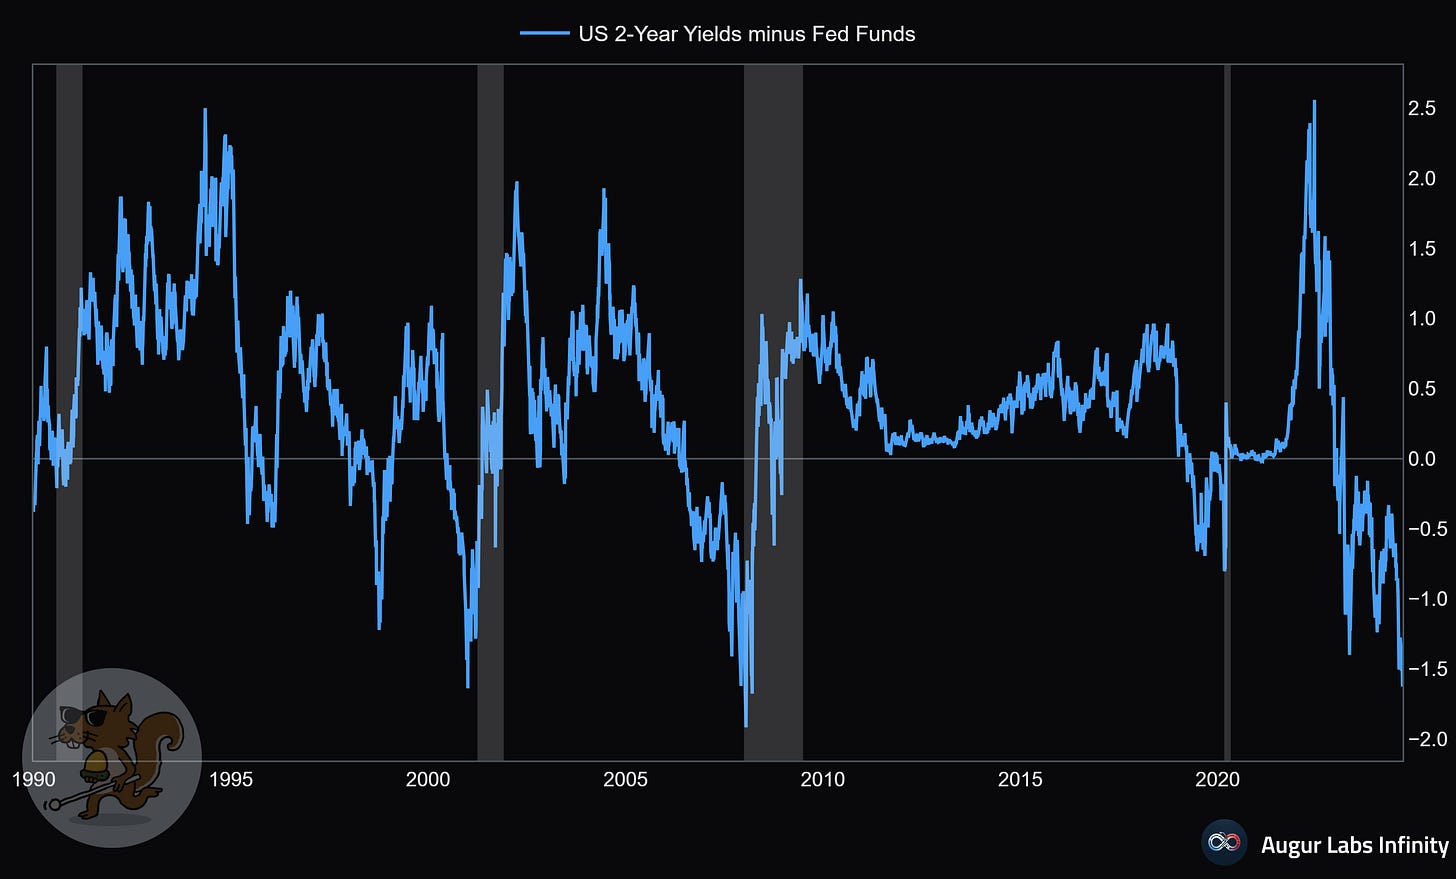
The bond market is steadfastly refusing to listen, and 2-Year yields have now plunged to a discount to Fed Funds last seen ahead of the ‘DotCom’ bust and the 2008/ 2009 Financial Crisis.
Short-term interest rate futures stubbornly continue to price in more than 4 quarter point rate cuts by the end of this year.
To be honest, Friday’s jobs data failed to provide much further clarity to the STIR traders. Like November’s Presidential election, the (arguably moot) 25 vs 50 basis point September cut debate remains a ‘coin toss’. Dario Perkins did the best job at describing the potential outcomes.
Web search trends would suggest that US consumers are keener to learn about inflation and the cost of living rather than obtain get recession updates.
It may well be weighted to higher income quartiles, but, notwithstanding with Dollar General CEO Todd Vasos had to say about his customer base, the US consumer continues to grow consumption in real terms.
The high frequency data on economic activity prepared by Apollo’s Torsten Slok continues to underscore the fact the US consumer - in the aggregate! - still looks to be in reasonable shape.
Of course, we have had no shortage of opinion on policy rates from billionaire fixed income investors. Quite disappointed that Howard did not drop in for a latte with the 🐿️ while in Melbourne but he was probably too busy selling private credit to the Aussie ‘Super’ funds. By the way, the John Paulson headline below is slightly misleading relative to what he really said (“my best guesstimate would be around 3%, perhaps 2.5%”).
It is pretty normal for the post Labor Day issuance window to be very active for corporate debt capital markets, but CFOs and Treasurers would appear to be quite comfortable pricing their new bond issues at current levels. Who would be surprised with credit spreads where they are? We will return to credit spreads in a minute.
Small investors, judging by the continued swelling of TLT 0.00%↑ shares outstanding, continue to crowd into long duration fixed income in anticipation of reaping Treasury market profits like Paul Tudor Jones did during the 1987 crash. The 🐿️ wonders if this is the ongoing influence of ‘the Shaman of St. Bart’s’ and currently has a small put position on ‘the other side’ of this duration feeding frenzy. It is small primarily for reasons that I shall expand on further below…
…but also, because I just noticed that the machines (CTAs) have just flipped from short bonds (a position they have had on for ages) to long. This is data from the DBMF CTA replicator ETF. As a reminder, the replicators can easily flip back if their algorithms change their mind on what is driving performance in the Soc Gen Trend index. Andrew Beer, DBMF’s creator was on Top Traders Unplugged this week if you need a recap on his replication methodology.
Meanwhile commodities are doing a half decent impression of AA Milne’s manic-depressive donkey. Are they making the recession call? The 🐿️ is not one for inspirational quotes, but I could get behind Eeyore’s “weeds are flowers too” when it comes to looking at the Bloomberg commodity index futures (below).
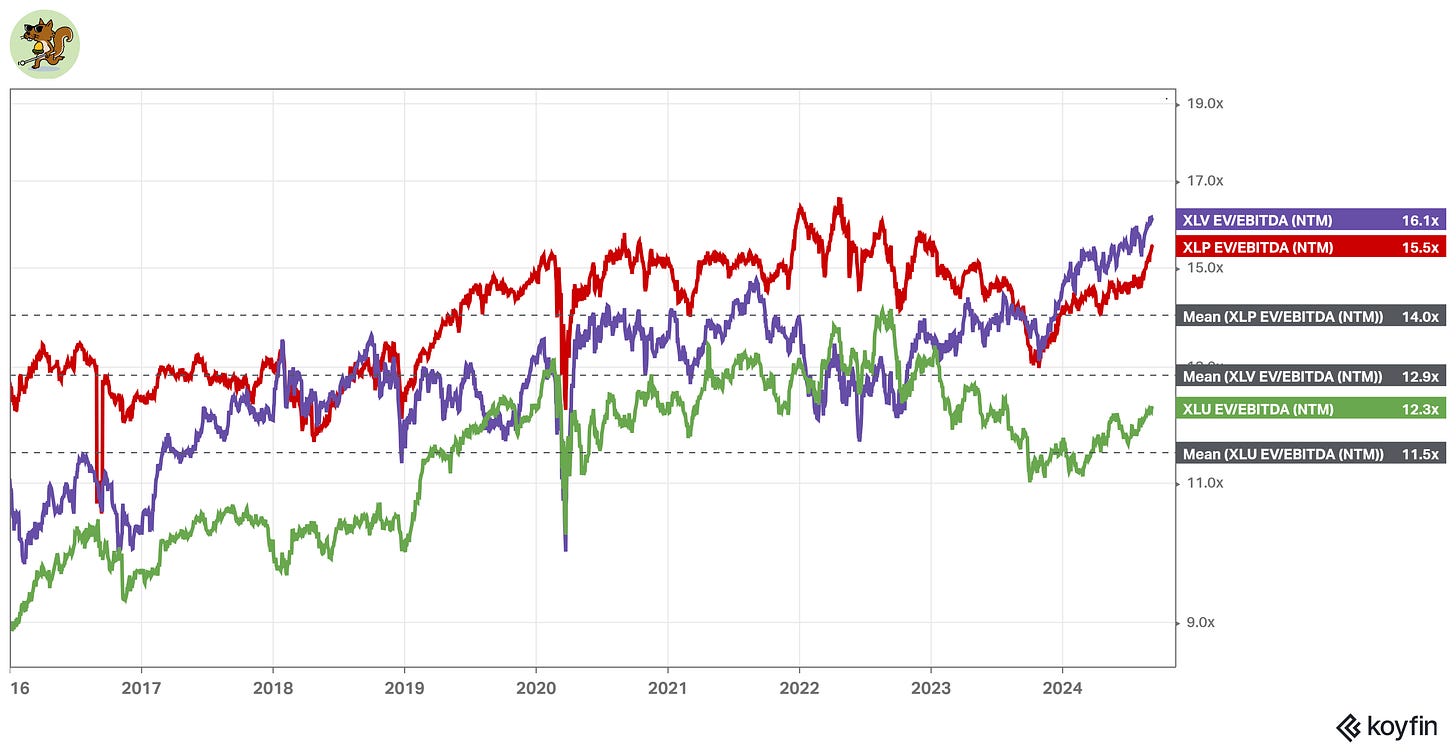
In equity markets, investors would appear to be battening down the hatches for an economic downturn judging by the outperformance of what the 🐿️ labelled ‘Grandpa’s Defensives’ back in April.

All 3 classic defensive (utilities, staples and healthcare) sectors are now trading at healthy premia to long term average cashflow (EV/EBITDA) multiples.
Close followers will know that this rodent has been skeptical about the strength of the US utilities since early June. I am offside on this trade. The initial thesis was that the halo effect of the AI-related power demand story was (i) probably overdone (even for the IPPs) and (ii) was boosting even those utilities unable to meaningfully profit from the trend (with their assets limited by regulated returns).
The AI frenzy has now been eclipsed by this recent rotation into defensives. Does hiding in ‘bond proxy’ equities really make sense here? So where can investors really find protection for their portfolios?
The cheapest hedges
One of the great pleasures of starting to write this newsletter has been the variety of new friends I have made in the world of independent research and market commentary. I remember Capital Misallocation’s Ben Brey from when his name was a permanent feature on investor targeting lists when I was trying to sell Asian consumer IPOs to Fidelity 15 years ago. Make sure you follow ‘Just THINK about it’, his excellent new show with Nadine Terman.
In the past year, I have enjoyed many hours of his night / my day (the 🐿️ operates a hotline for market enthusiast insomniacs based in the US!) debating markets and risk with Ben. He has developed a model that looks at the cost of pricing convex (low risk, high reward) bets on dislocation across equity, rates, FX and credit markets.
He calls his model the ‘Price of Convexity’. I like to think of it as a fantastic measure of extreme complacency in asset markets over time. Measures of extremes in low prices for convex hedges has often been a harbinger of imminent violent dislocation in asset markets, as the chart below clearly demonstrates.
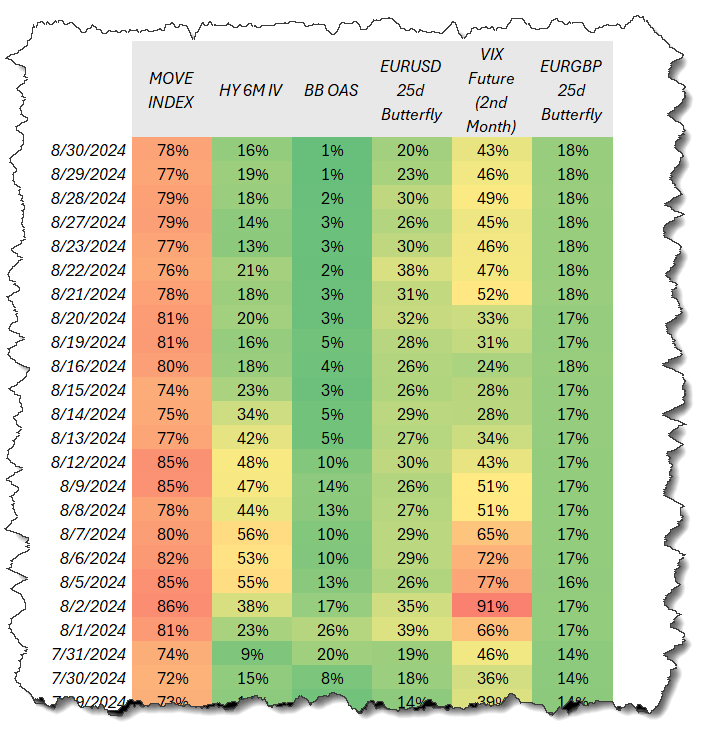
The chart above plots an average cost of those insurance products over time. However, there is a significant variation in relative value between these risk hedges across the various asset classes. The table below gives a snapshot of where measures of risk currently sit in percentile terms versus a multi-decade period. The higher the percentile, the more expensive the convex hedge relative to history.
Let’s break it down, starting with rates and equities. US Treasury volatility, as measured by Harley Bassman’s MOVE index is sitting in an elevated 78% percentile. To pick up on my earlier point, puts in TLT 0.00%↑ (fading the Shaman!) is possibly not the cheapest tail hedge out there right now.
Early August’s ‘carry unwind’ shock momentarily pushed equity implied volatility (for Ben’s model, the second VIX futures contract) into the red zone but the cost of equity ‘insurance’ has subsequently mean reverted back in price but not yet to ‘Dollar General’ levels of value.
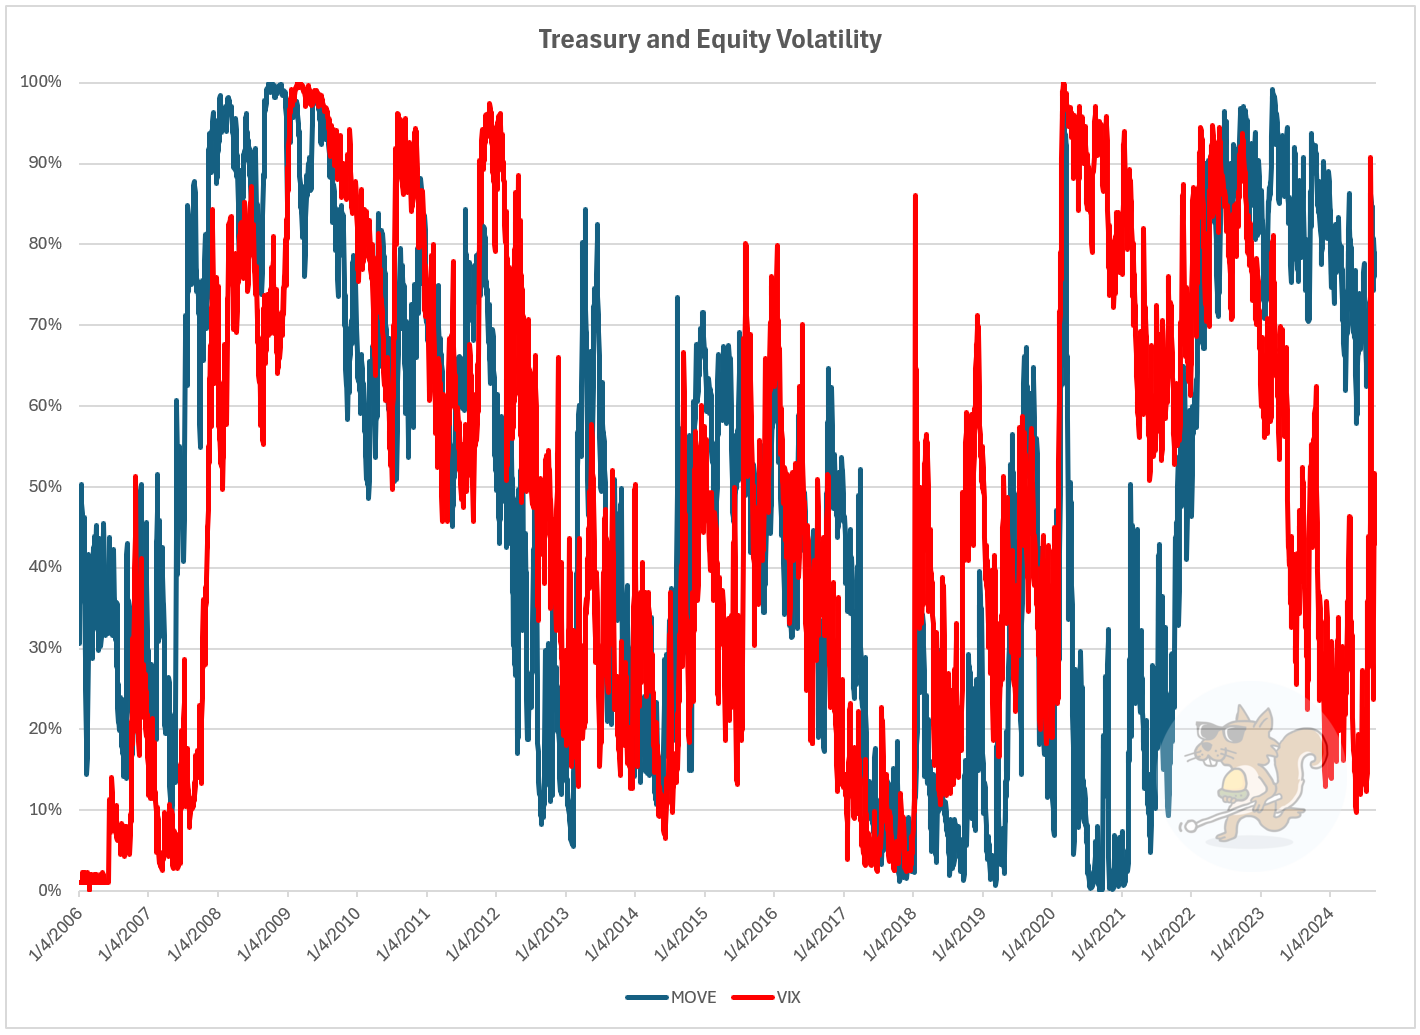
Interestingly rates and equities are offering mirror-like characteristics at the moment. Since interest rates started rising in 2022, treasury volatility has been very high versus its history, but relatively stable at those high levels. On the flip side, equity implied volatility (the VIX) has been in a downtrend for the past 2+ years but exhibiting moments of extreme skittishness (i.e., high volatility of volatility).
Dean Curnutt’s most recent Alpha Exchange podcast, ‘Lessons from the rowdy VIX’ was brilliant at exploring some of the reasons for this difference. It is only 15 minutes long and definitely worthy of your time!
Foreign exchange convexity insurance (benchmarked in Ben’s model via the cost of 25% delta butterflies on EURUSD (blue) and EURGBP (orange)) still looks like reasonable value relative to the past 20 years.
However, when you look at the insurance premium ‘ask’ in credit markets, benchmarked here looking at high yield bond implied volatility (green) and, in particular, with high yield credit spreads (orange) we enter the Dollar General ‘value’ category of convex hedges!
Here we get to the title of today’s piece: ‘I’m axed at zero’. ‘Axed’ is trader parlance for being a buyer or a seller of a position in a security at a certain price. For this rodent, high yield (sub investment grade) credit spreads have got to a point at which any major further contraction (in spreads), while not impossible, seems very tough to envisage.
I can hear the sighs already. Sadly, for individual investors, buying credit protection is not straightforward. ‘Whining’ Billy Ackman may be able to buy convex credit default swap strategies, but buying puts on HYG 0.00%↑ or JNK 0.00%↑ (the largest high yield bond ETFs) has tended to be both an expensive and low expected value hedging strategy over the years. Unless of course you get the timing down to perfection.
The recession call has caught pretty much 100% of economic forecasters and pundits offside for the past 2 years. The excellent Dario Perkins from TS Lombard was back with Kevin Muir on The Market Huddle this weekend. The title of the show was ‘A credit cycle that hasn’t cycled’. Dario points out that the credit cycle has been making idiots of us all since the GFC. Surely timing a credit bet to perfection is a fool’s errand?
The 🐿️ thinks he might have a solution. Limited fireworks, but potentially remarkably effective.
Don’t miss out! Please consider becoming a paid subscriber to receive the other 60% of 🐿️ content (including this latest thought on credit hedges!), member Discord access (The Drey) and even ‘limited edition’ merch!


