

Scooby-Doo and Vincent Vega walk into a bar.
The Blind Squirrel's Monday Morning Notes, December 4th, 2023.


Summary
Markets have reacted to dovish inflation data and pause-suggestive language from central bankers like Pavlov’s dogs. The move in risk assets (especially long duration assets) since Halloween has been spectacular.
A bit like teeth flossing and foam rolling, buying portfolio insurance when markets are screaming higher is a really tough thing to do.
Higher interest rates and low levels of implied volatility are creating ‘Black Friday’ sale conditions for buying protection.
This week’s portfolio update and Acorn review (for paid subscribers) covers #uranium #bonds #gold #silver #ags #energy #offshore #PrivateEquity #UK midcaps #AUDUSD and #ChIndia.
The audio companion to this week’s note will be uploaded to Substack on Tuesday to allow me to incorporate comments and feedback from this note. It will also be available as a podcast on Apple, Spotify and the other usual podcast apps.
Scooby-Doo and Vincent Vega walk into a bar.
The bad news is that the 🐿️’s formal academic education contained more Ancient Greek than calculus. The good news is that a lot of my professional career was spent in roles where I needed to explain how options work to irregular users of the product.

This week are going to do some jargon busting around options. A couple of Greek words, Rho and Vega, will make an appearance. We are also going to show how these 2 words are important ingredients to the low-cost insurance for your equity portfolio that is available right now.

Rho represents the change in the price of an option from changes in interest rates. In a rising interest rate environment, the value of call options rise and the value of put options fall. The same works in reverse when interest rates fall.
Vega represents the change in the price of an option from changes in implied volatility. The higher the level of implied volatility, the higher the price of put and call options. ‘Science bit’ / Greek lesson over!
Let’s start with interest rates. I am not going to add to the mountains of Fed speak commentary out there. We set out our thoughts on rates in “Sorry Harley, the 2 Year note is not for babies!”, our latest fixed income Acorn trade. In the space of the past 6 weeks, the markets have price additional 3 rate cuts between now and early 2025.

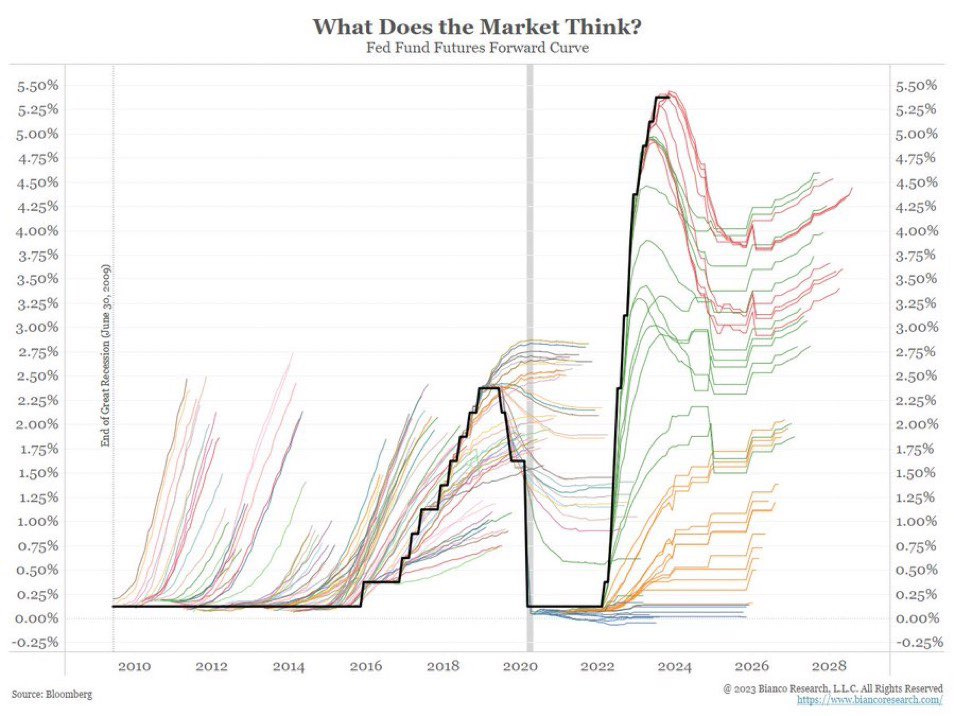
But before you think that markets are infallible, a salutary reminder from Jim Bianco below that money market futures have, in the past, seldom correctly forecasted the actual future path for rates.
Markets have reacted to a dovish inflation data point and pause-suggestive language from central bankers like Pavlov’s salivating dogs. The move in risk assets (especially long duration assets) since Halloween has been nothing short of spectacular. Cash incinerating Web 2.0 companies like Opendoor OPEN 0.00%↑ have even started booking Superbowl advertising slots. We are so back!


Market up, implied volatility down is normal. However, why is implied volatility back at ‘Black Friday’/ ‘Cyber Monday’ levels of relative cheapness?

We wrote back in August in “Master of the House and Sundae Sprinkles” about how rising rates had driven a major comeback for the structured products new issue business (including a section on how you could build one yourself with better terms and no fees). Growth in this activity increases the supply of volatility to the market, driving down prices (implied volatility).
This supply has been augmented by the explosive growth of volatility selling in the fast growing and much discussed “0DTE” SPX daily options market. Selling short-dated volatility has been a highly successful strategy year-to-date. Success inevitably brings in competition (and lower premiums for sellers of those options).


To be clear, the 🐿️ is by no means arguing for an imminent crash in equity markets. For that, please read ‘Doom Lords’ elsewhere! I am not ready to short equity markets outright here, but equity portfolio insurance is a screaming buy at these levels.
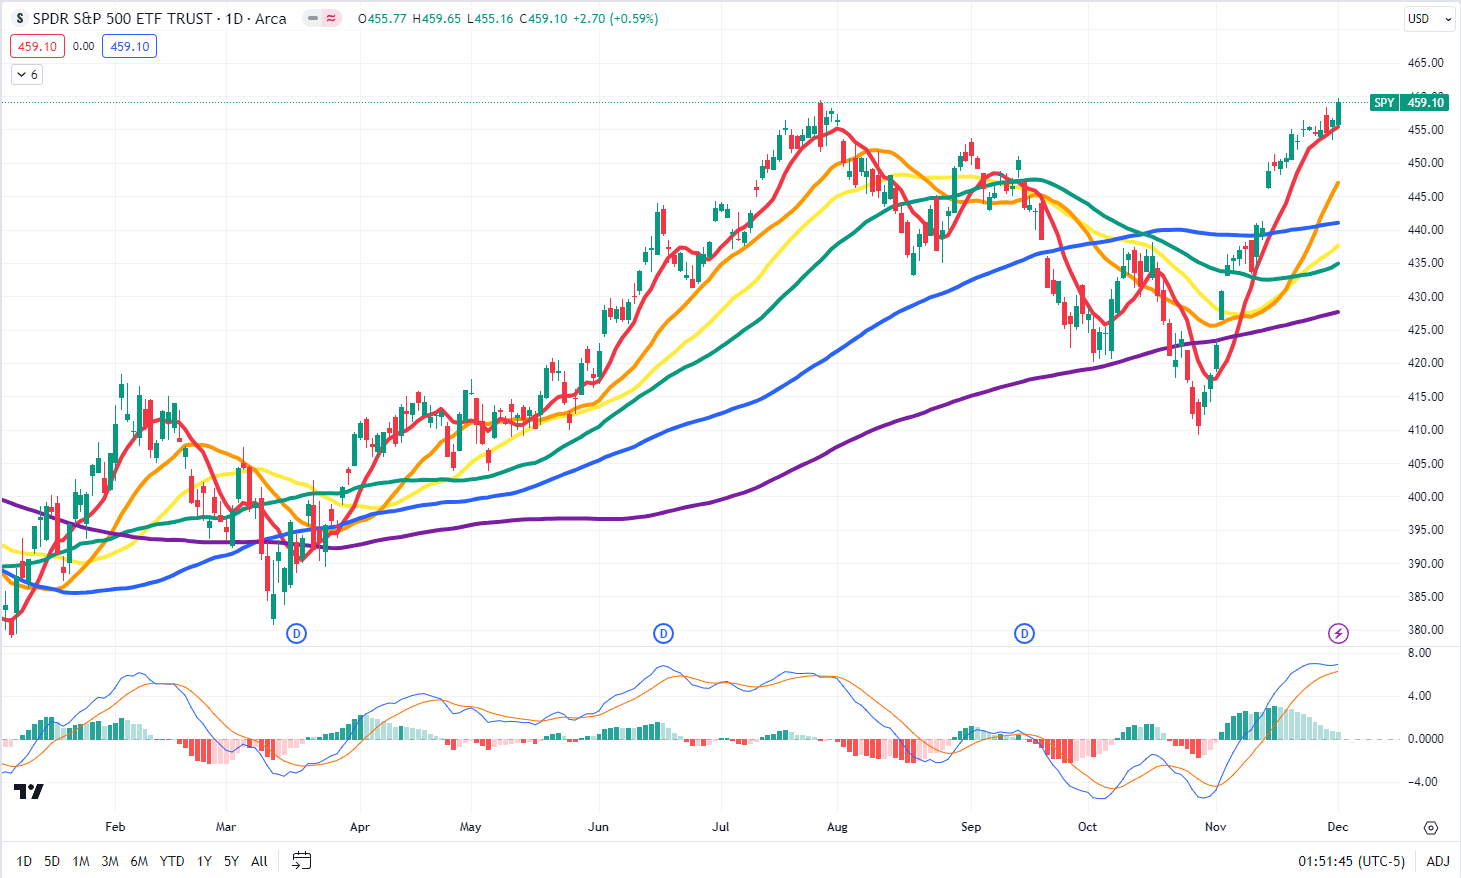
Let’s have a look at the cost of at-the-money put protection for the SPY 0.00%↑ ETF (the most popular S&P 500 index tracker). SPY closed on Friday at $459.01 per share.
Why an at-the-money put? Again, it comes down to supply and demand. The put writing and structured product activity mentioned above increases the supply at closer to the money strikes.
Traditional buyers of crash insurance are still drawn to the convex payoffs of deep out of the money puts (not that this strategy has paid off for a long time!). Put simply, the prices of these crash puts have not dropped as much as close to the money alternatives, and we are shopping for bargains here!

A December 20th, 2024, $460 put option (slightly in the money) will cost you $23.71 per share (about 5.15%). This pricing bakes in implied volatility of 17.7%, an expected dividend of $1.64 per share per quarter and a forward (interest) rate (which takes into account the rate cuts priced into interest rate futures as demonstrated above) of 4.17%.

Interest rates can always go back up and implied volatility could indeed carry on going down. However, it feels to this rodent that current pricing levels offer up a decent margin of safety. This is before taking into account any move in the price of the S&P 500 itself.
Let’s look at this SPY put in the OptionStrat model (linked here).


A bit like teeth flossing and foam rolling, buying portfolio insurance when markets are screaming higher is a tough thing to do.

It is tough not to come to the conclusion that the central bankers are not far from verbally intervening to take some of these new rate cut expectations back out of the market. Alternatively, have they had sight of some economic data to suggest that cuts might in fact be needed earlier than previously thought? Either of these outcomes would not be friendly for equity markets.
We have mercifully been out of our bearish equity bets since late October. While not calling for an imminent turn in risk assets, it feels like there is some skittishness about investors and that sentiment could turn negative as quickly as it turned positive. Meanwhile protection is ‘on sale’. Feels like a smart time to buy it!
That’s all for the front section this week. This week’s portfolio update and Acorn review (for paid subscribers) covers #uranium #bonds #gold #silver #ags #energy #offshore #PrivateEquity #AUDUSD #UK midcaps and #ChIndia.
🐿️ subscribers also received a new fixed income Acorn last week (paywalled link below) looking at value opportunities in UK midcaps. Details of our subscription service here.

Kevin Muir was kind enough to have me back on The Market Huddle last week. A link to the show below for those that missed it.
