Hey Jordan, sell me this chart!
March 24th, 2025. Weekly update for the 🐿️'s BUSHY™ Multi Asset ETF Portfolio and live Acorn trade ideas. 2025, Week 12.

Before we get going, a couple of things to stick in your listening / watching queue in case you missed them last week.
On Monday I was back on with Maggie Lake after the US close. It was not all about China - we went deep on broken crockery too. Maggie’s write up of the call is here.
However, on Wednesday I spent a fantastic 40 minutes talking nothing but the Middle Kingdom with Leonid Mironov of PACAT Capital Management in Hong Kong and author of Panda Perspectives. Link to show and my lovingly curated notes below 👇.

I am already very excited about the next interview show. After a pretty major drought of US IPOs, filings by Klarna and Coreweave are creating some headlines as well as some outstanding memes. A cocktail of instalment loans for DoorDash burrito deliveries and Adjusted EBITDA that excludes interest expense has the 🐿️ reaching for an extra-large box of popcorn.
What a brilliant time to welcome Craig Coben, a fellow Wall Street capital markets veteran and now frequent contributor to the FT’s Alphaville column to the pod. I am looking forward to discussing just how uncomfortable certain US ECM Syndicate heads must be feeling right now. We chat on Thursday. Expect plenty of war stories!

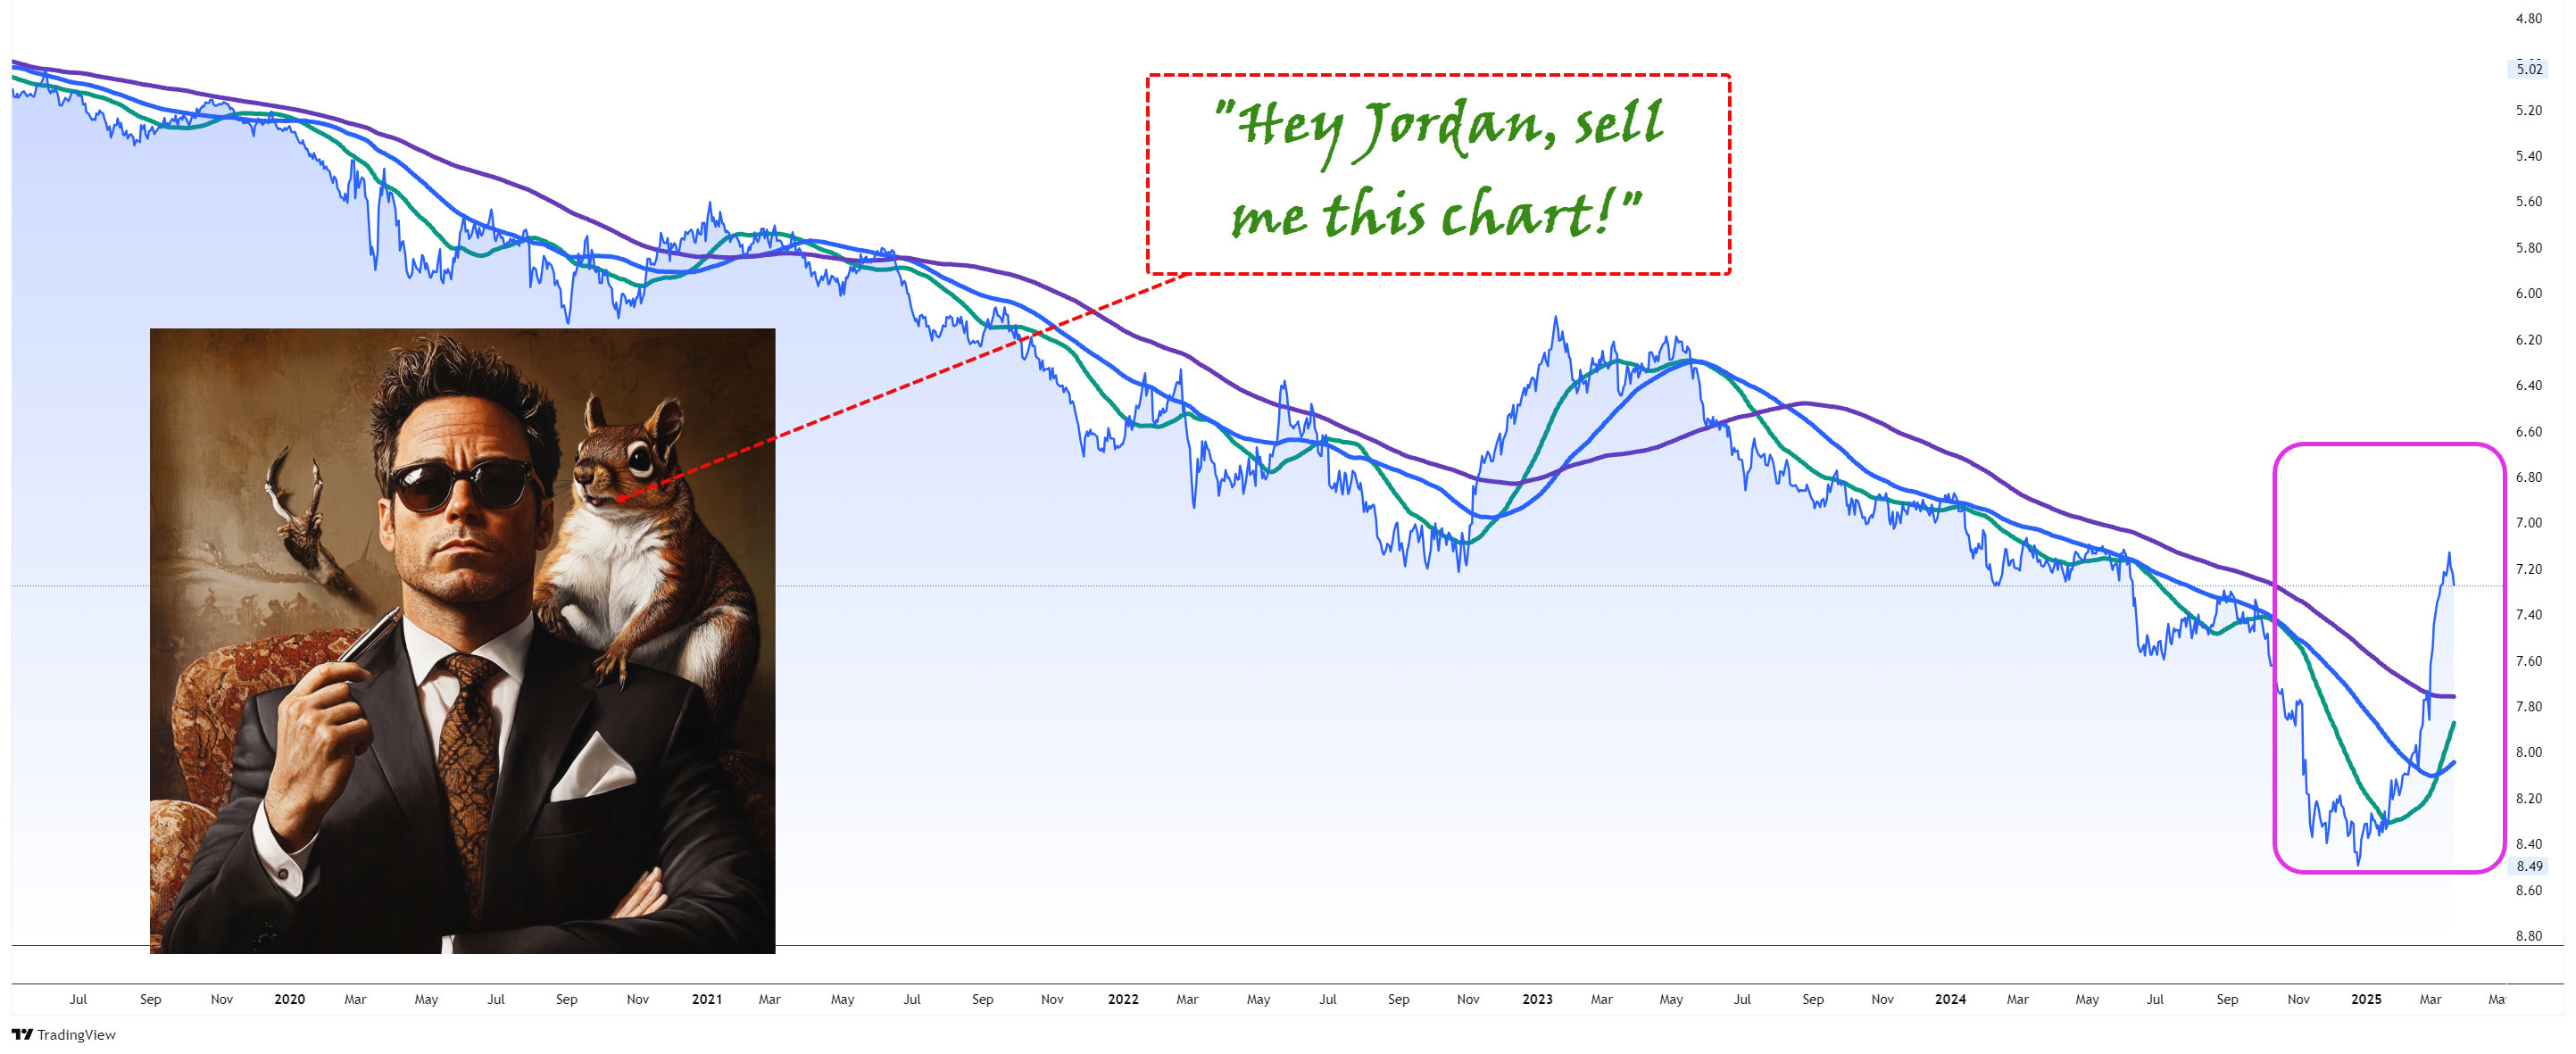
But we start this week’s weekly portfolio review with a quick quiz, ‘Wolf of Wall Street’ Jordan Belfort style:

Not hard, right? A powerful breakout from a multi-year drawdown. You would buy that chart all day and all night. The 🐿️ agrees.
The chart below is exactly the same thing - my favorite S&P 500 (SPY) relative to the MSCI EAFE (Developed Markets ex US) chart - but this time uninverted!

The RSI on the chart extended into extreme downside territory in early March. Some kind of pause has to have been inevitable. If we are right, this chart represents a significant regime shift and trend break in major global asset classes, following 15 years of one-way traffic in the opposite direction.

Yet my inboxes are overflowing with arguments literally begging me to fade the move and that the reestablishment of the exceptionalism of US financial assets is inevitable. Let me paraphrase the tone of these messages:
“Hey🐿️, check out the latest Bank of America Fund Managers survey! ‘Everyone’ is long. Europe and China are basket cases and all the macro tourists and ‘late arrivals’ to the international rotation trade are going to get wrecked!”
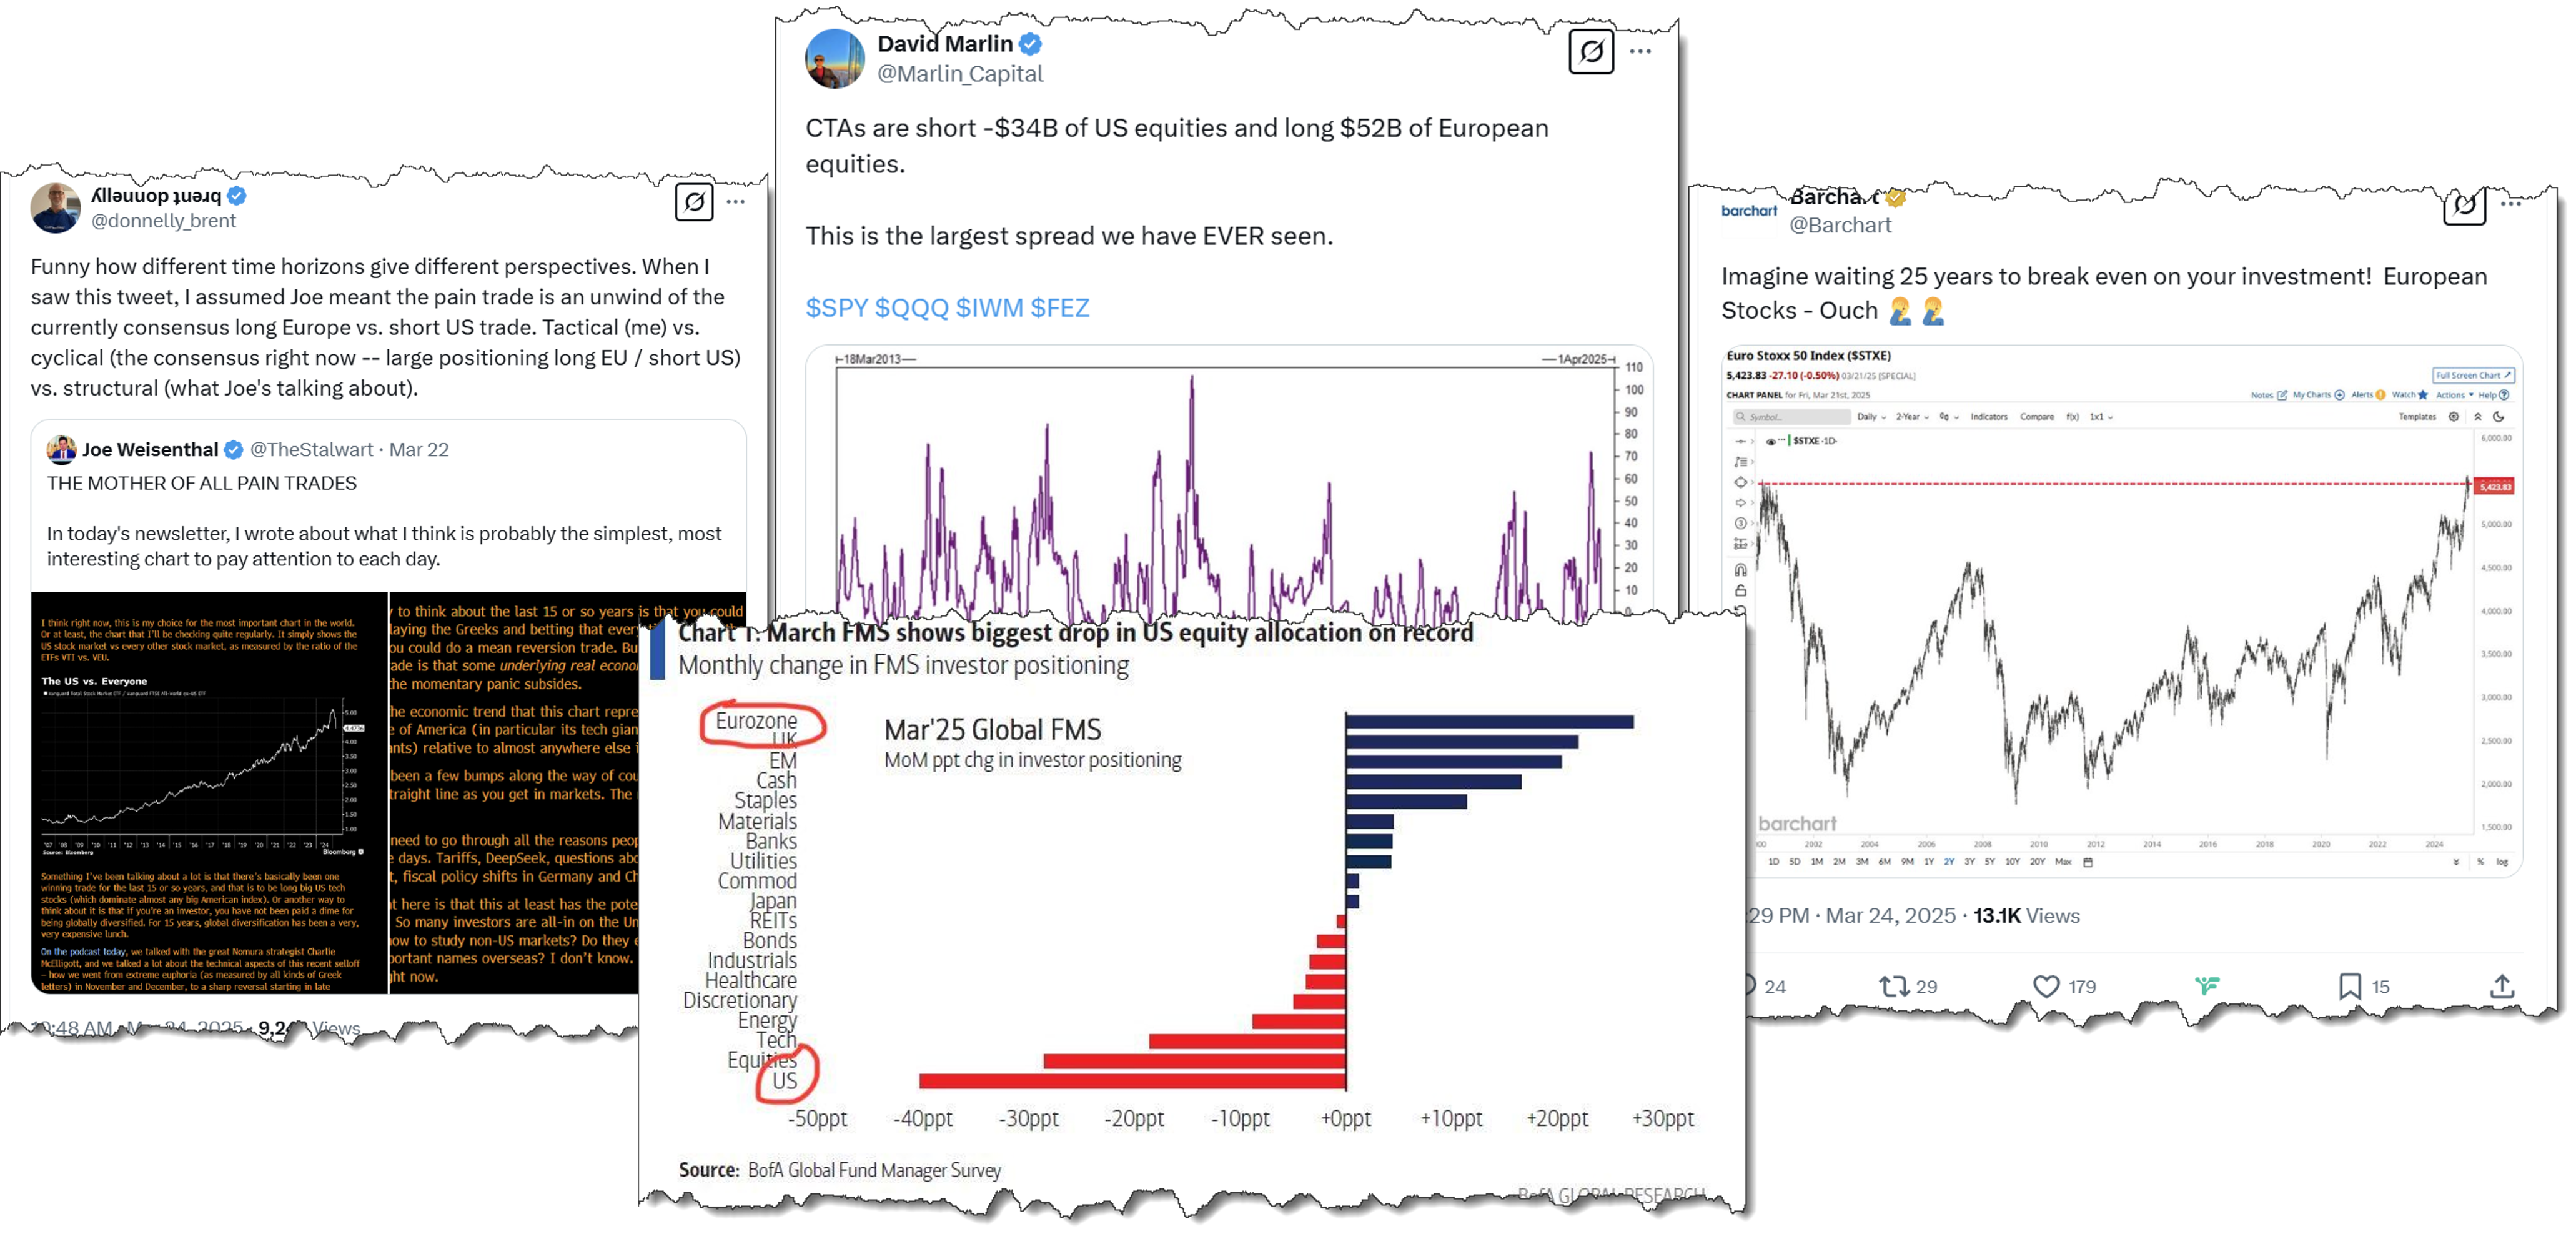
As I wrote last week, “While I am open to the possibility of a few green days, it feels like US equities are in distribution mode and that any rallies will flush out new sellers. I am sticking to my belief that allocators of capital (especially of the non-US variety) are divesting US assets.”
Well, we got a few of those green candles in US equities last week but, for the most part international equities also had a decent week. The 🐿️ is sticking with the rotation view and is positioned accordingly but would not be surprised if the stance gets tested in to quarter end.
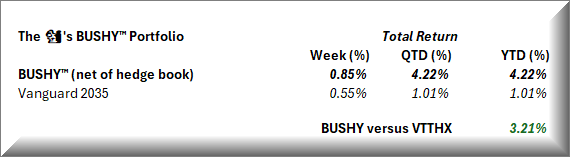
The BUSHY™ Portfolio - Week 12
Plenty going on this week besides the usual BUSHY™ update (which includes some thoughts on BUSHY’s hedge overlay). Acorn updates this week include coverage of ‘low beta’ China, Japanese banks, Euro defense and a better week for energy equities.

The 🐿️’s BUSHY™ portfolio, which is massively underweight US equity and fixed income relative to its Vanguard ‘Target Date’ fund benchmark, was up 0.85% last week, moving to fresh highs for the year. It closed the week 3.21% ahead of its benchmark.