Acorn: Long Grains
Tongalese volcanoes, Solar minimums, Flash Frost Event risk, Gleissberg cycles and La Nada Modoki. Add a side order of geopolitics. No assurances, but 2023 could get interesting for grains.
Thursday 24th February 2023
Summary
A number of coincidental climate phenomena raise the odds of drought in key crop growing geographies around the planet.
Geopolitics adds to this heady cocktail. War tragically rumbles on in Ukraine, China’s evolving diet exports food inflation to the world just as the pendulum shift from labor to capital puts food price inflation at the top of global political priorities.
In 2023, an understanding of forces impacting agricultural commodities is no longer an ‘elective’ discipline even if you do not invest directly.
Having said that, the could be some asymmetric investment opportunities in the grains space. An extreme event appears mispriced.
Today, we added a position in a strip of call options (January 2024 expiry) in $DBA, Invesco’s DB Multi-Commodity Agriculture ETF.
Background
Let me start with a very important caveat. The 🐿️ is certainly not a climate change denier, neither is he a meteorologist or climate scientist. I am about to cite climate research and theories that have existed for hundreds of years and share evidence of repeating weather patterns that may end up, with hindsight, being purely circumstantial.
To be clear, I readily accept that human activity and fossil fuel consumption is a key driver of climate change. I also know that it has been several hundred years since we saw a ‘frost fair’ on the River Thames in London.
I am therefore more than happy to give equal billing to the IPCC’s views on the impact of solar activity on climate change, outlined below. Read it in detail on NASA’s website here. Key paragraph below:
According to the United Nations’ Intergovernmental Panel on Climate Change (IPCC), the current scientific consensus is that long and short-term variations in solar activity play only a very small role in Earth’s climate. Warming from increased levels of human-produced greenhouse gases is actually many times stronger than any effects due to recent variations in solar activity… For more than 40 years, satellites have observed the Sun's energy output, which has gone up or down by less than 0.1 percent during that period. Since 1750, the warming driven by greenhouse gases coming from the human burning of fossil fuels is over 270 times greater than the slight extra warming coming from the Sun itself over that same time interval.
I do not propose to take you down a rabbit hole of multi-decade weather cycle charts, detailed ocean surface and stratosphere temperature maps and inter-planetary diagrams. Shawn Hackett of Hackett Advisers does an excellent job on this and I highly recommend his work. We get terrific value from his weekly note. Shawn has been discussing this theme broadly for some months in the public domain. This interview on Realvision (free on YouTube) is a good introduction to his work. I have set out my summary of this weather thesis after the trade description at the end of this note. Bottom line, I am not qualified to make predictions of extreme weather events and severe droughts in 2023 (and frankly would very much prefer that it did not happen). All I am saying is that it represents a significantly underpriced risk which could give rise to an asymmetric payoff in agricultural prices if it occurs.
Then let’s take a look at the geopolitics. As we enter the second year of conflict in Ukraine, front month wheat futures are ‘only’ trading at the upper end of a multi-year $4.60 to $7.60 range. Without seeking to claim expertise as a military strategist, further disruption of the Black Sea ‘grain corridor’ as a result of an escalation in hostilities would also seem to be a potentially underpriced risk.
Next up, let’s have a look at the politics of food inflation. Russell Clark has being doing a really amazing job on this on his Substack. His broader thesis on the impact of food price inflation on interest rates is worth exploring in detail. After all, bread prices have been political dynamite ever since the days of Marie Antoinette. China has been in the business of exporting food inflation to the world as it becomes a major grain importer to support its population’s increasing appetite for meat, especially pork. This hunger for grains is creating shortages elsewhere - even amongst major food exporters like Brazil.
On Brazil, Russell observes the following:
Brazil is exporting more food than ever before, but Brazilians are the hungriest they have been in 20 years. How did this happen? The big shift is that China is now a large corn importer…..Politically, it is very difficult for governments to sit idly by as farmers export records amounts of grain at record prices as hunger stalks its poor. Policy options for Brazil include export taxes, export bans or a range of other policies. Unless food prices collapse in China soon, I expect Brazilian food supply to be curtailed, and a food spike in the rest of the world to ensue. This should lead inflation to surprise to the upside again.
The 🐿️ has seen enough.
How to play it
Food and fertilizers has been a core component of our portfolio for the past couple of years and I do not see this changing for some time to come. We currently own exposure via positions in nitrogen fertilizer plays, CVR Partners ($UAN) and Netherlands-listed OCI NV. Volatility in natural gas pricing and post Ukraine invasion position crowding has made for a pretty bumpy ride. The broader sector, including Mosaic, CF, Intrepid Potash and Nutrien is shown below.
In terms of direct exposure to Ag commodities, we already have current exposure to Cocoa futures (Sept), Coffee (via the $JO ETF) and options on Wheat futures ($ZW, April and September). We have not had corn or soybean exposure in the portfolio since last July.
Note: For readers unable or unwilling to invest directly in futures markets, a number of US listed ETFs and structured notes can give you direct exposure to individual commodities (albeit with management fees). Teucrium, for example, offers a suite of futures-backed ETFs for pure exposure to the core grains and sugar futures complex.
For non-US investors, watch out for the new withholding taxes on PTPs (Publicly Traded Partnerships) for these types of futures-backed ETFs. You will need to own a vehicle with a “Qualified Notice” in place (unless your exposure is only via options). This is categorically not tax advice, but Interactive Brokers publishes a list of the entities that have (and those that do not have) this notice. The Teucrium ETFs and DBA are on the IBKR list.
In terms of related weather plays, the most obvious candidates are wheat, sugar, rice and cocoa. Coffee and pork (lean hogs) are also interesting. Having said that, in a world of constrained supply, proteins and grains become very much interchangeable. In other words, in a world where wheat prices rise 30%, corn and soybean prices are very unlikely to be unchanged!
As such, for the purpose of this Acorn, we are going to track an investment in a diversified play in the Ag commodities via $DBA, Invesco’s DB Multi-Sector Agriculture Fund. DBA holds a basket of Ag futures based on DB’s agricultural commodity index.
We like this vehicle for the following reasons:
A broad-based exposure to food commodities but with a total weighting towards our focus ‘plays’ of wheat, cocoa, sugar, coffee and pork of over 56.4%. Full split of holdings in the table below and Invesco’s website.
For those readers unwilling to trade options, DBA would be a great ‘one stop shop’ to capture the themes we are discussing. The expense ratio is 0.93% - not super cheap, but acceptable for a futures-backed vehicle such as this. The down side of a DBA only approach is that, at just over 11% of the basket, you are possibly under-exposed to the wheat story. This could be remedied by buying Teucrium’s $WEAT ETF in a 3:1 ratio (1 WEAT share for every 3 DBA shares) to create an ‘overweight’ wheat setup.
DBA’s chart looks compelling on a daily time frame, recently recapturing the 200-day SMA1, with the 40 EMA crossing back above the 50 EMA last week.
DBA has a reasonable history, dating back to just prior to the GFC. On the monthly chart the post-Ukraine-invasion spike has been normalized. The longer timeframe chart also illustrates prior drought related highs (eg 2012).
Finally, DBA also benefits from a liquid option chain, although the bid/offer spreads on the far out-of-the-money strikes are reasonably wide - DO NOT ENTER MARKET ORDERS!.
Trade Construction
On February 23rd, we have purchased a strip of call options on DBA out to January 2024. For every 2 $20 strike calls, we have bought 1 each of the $22 and $24 strikes, 2 of the $25 strike and 5 of the $30 strike.
The lowest leg strike of the strip is already marginally ‘in the money’ and over 70% of the premium outlay is dedicated to towards a decent sized ‘Day 1’ exposure to the underlying ETF via the $20 and $22 strike calls. However, we have reserved balance of the initial premium invested to give us an ‘exponential’ exposure to a major move to the upside via the higher strike calls.
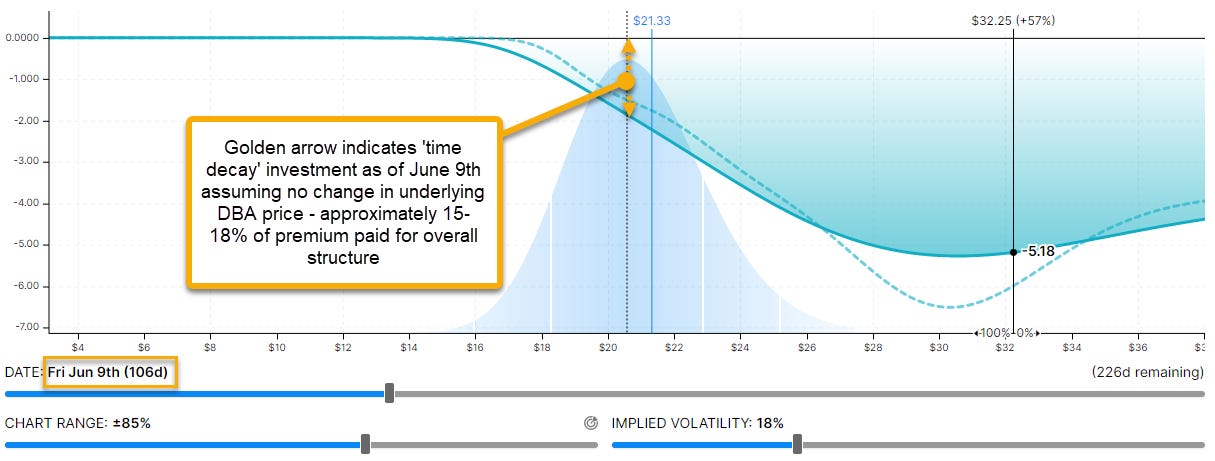
Breakeven (at maturity) for the structure kicks in at just below $23 (+11%). The goal of this strip is to give us decent participation in the event of modest appreciation of the sector, but with significant leverage in the event of an extreme “right tail” event (i.e. returns in excess of 1000% in the event of a repeat of the 2012 drought spike).
The table below illustrates the payoff over time. Note the turquoise line annotation in the table. As indicated in the weather thesis summary below, a normal transition from La Nina to El Nino by the time of the Northern Hemisphere summer effectively rules out a Gleissberg-related extreme weather event. If El Nino arrives by June we will restructure the position to recover premium from the higher strikes. As such, our exposure to option time decay in the options is limited to just over 100 (out of 330) days.
Clearly there is greater downside in the event that the DBA share price falls between now and June, and this should not be ignored. But by June you will know if the extreme weather event is in fact in play. In other words, there is an additional leverage built in to the structure given the scope of option premium recovery in June (i.e. it is not really a 3% of NAV play unless the bottom falls out of the diversified Ag space).
As ever, the structure is loaded up publicly on OptionStrat via this link. Please feel free to toggle the assumptions a get a better understanding of the forces influencing the payoffs of the structure under various circumstances (price, time and implied volatility).
Summary of the extreme weather thesis
In short, the possibility of drought impacting Northern Hemisphere grain crops (as well as West African Cocoa crops and India’s July Monsoon) could be increased by a number of factors:
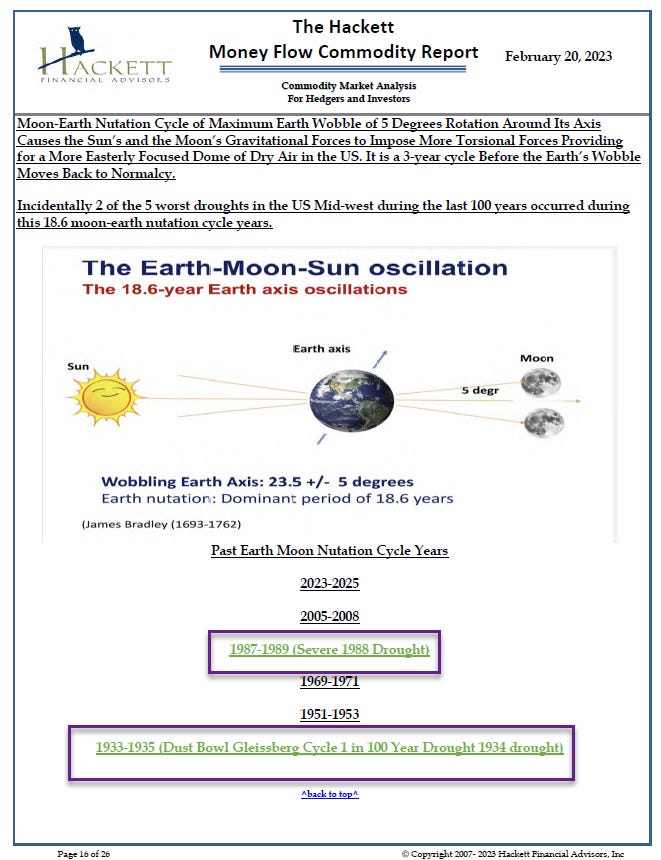
A delayed transition from La Nina to El Nino, combined with the start of the 89 year ‘Gleissberg’ drought cycle in combination with the 18.6 year Earth axis oscillation cycle (aka Earth Moon nutation cycle years) could occur in 2023.
This combination of cycles coincided with the 1988 droughts and the US ‘dust bowl’ drought crisis of 1934. Note that this Gleissberg impact is NEGATED by a normal La Nina to El Nino transition this spring/ early summer and that Hackett’s call for a delayed transition is out of consensus.
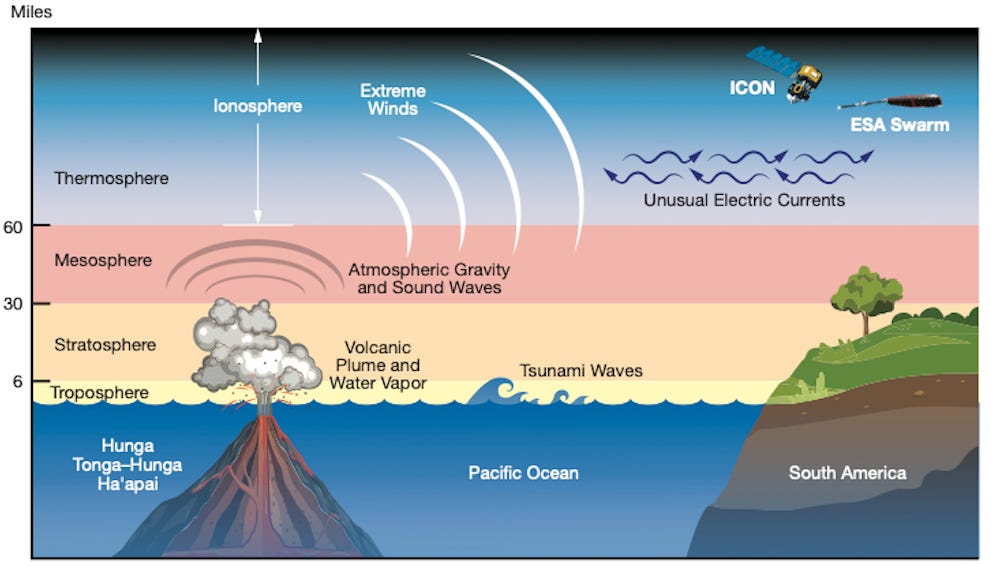
Water vapor concentration in the stratosphere from the 2022 volcanic eruption in Tonga has the effect of cooling our outer atmosphere, creating increased weather volatility. Note Argentina’s recent weather extremes (extreme heat and a soft frost within days this month).
Sudden Stratospheric Warming events driving an increased risk of ‘flash frost events’ in the grain-growing geographies of Europe and China. This could happen as early as mid to late March.
La Nada Modoki. Last seen in 2012 (when the US has a 1-in-50 year drought), Modoki occurs with a failed transition from La Nina to El Nino. The “Cold Ring” off the California coast has a role in preventing moist air from reaching North America from the Pacific Ocean. The weather patterns that we are currently seeing now (drought in Argentina, Brazil very wet) have striking similarities with 2012 (and 1934).
Final Thought
Remember that big storm up on Mount Washington, New Hampshire earlier this month? Guess what? A similar thing happened in April of 1934. Just saying…

If you act on anything provided in this newsletter, you agree to the terms in this disclaimer. Everything in this newsletter is for educational and entertainment purposes only and NOT investment advice. Nothing in this newsletter is an offer to sell or to buy any security. The author is not responsible for any financial loss you may incur by acting on any information provided in this newsletter. Before making any investment decisions, talk to a financial advisor.
SMA = Simple Moving Average; EMA = Exponential Moving Average.


